SpreadSheet Munging Strategies in Python - Pivot Tables - Simple Unpivoting#
Pivot Tables - Simple Unpivoting#
updated : September 25, 2024
This is part of a series of blog posts about extracting data from spreadsheets using Python. It is based on the book written by Duncan Garmonsway, which was written primarily for R users. Links to the other posts are on the sidebar.
The key takeaway is this - you understand your data layout; use the tools to achieve your end goal. xlsx_cells offers a way to get the cells in a spreadsheet into individual rows, with some metadata. The final outcome however relies on your understanding of the data layout and its proper application.
Pivot tables offer a summarized version of the data, and are usually succinct and visually appealing. However, for analysis, it is not so good. How do we convert pivot tables to tidy data? This section covers that. We’ll see various kinds of pivot tables, and work through each of them.
# pip install pyjanitor
import pandas as pd
import janitor as jn
import sys
import numpy as np
print("pandas version: ", pd.__version__)
print("janitor version: ", jn.__version__)
print("python version: ", sys.version)
print("numpy version: ", np.__version__)
pandas version:  2.2.2
janitor version:  0.29.1
python version:  3.10.14 | packaged by conda-forge | (main, Mar 20 2024, 12:51:49) [Clang 16.0.6 ]
numpy version:  2.0.2
excel_file = pd.ExcelFile("Data_files/worked-examples.xlsx", engine="openpyxl")
Case 1: Multiple Row and Column headers#
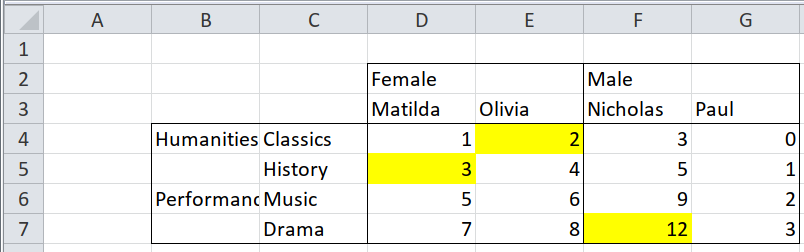
Observations:
There are two header rows - gender and names.
There are also two header columns on the left - Fields(Humanities, Performance) and Subjects(Classics, History, …)
For this case we wont be concerned with the colour formats. We’ll look at that in a later section.
df = excel_file.parse(
    "pivot-annotations", header=[1, 2], index_col=[0, 1, 2]
).droplevel(axis=0, level=0)

df
| Female | Male | ||||
|---|---|---|---|---|---|
| Matilda | Olivia | Nicholas | Paul | ||
| Humanities | Classics | 1 | 2 | 3 | 0 |
| History | 3 | 4 | 5 | 1 | |
| Performance | Music | 5 | 6 | 9 | 2 |
| Drama | 7 | 8 | 12 | 3 | |
df.index.names = ["field", "subject"]
df.columns.names = ["gender", "student"]

(
    df.stack(["gender", "student"], future_stack=True)
    .rename("scores")
    .reset_index()
    .ffill()
)
| field | subject | gender | student | scores | |
|---|---|---|---|---|---|
| 0 | Humanities | Classics | Female | Matilda | 1 |
| 1 | Humanities | Classics | Female | Olivia | 2 |
| 2 | Humanities | Classics | Male | Nicholas | 3 |
| 3 | Humanities | Classics | Male | Paul | 0 |
| 4 | Humanities | History | Female | Matilda | 3 |
| 5 | Humanities | History | Female | Olivia | 4 |
| 6 | Humanities | History | Male | Nicholas | 5 |
| 7 | Humanities | History | Male | Paul | 1 |
| 8 | Performance | Music | Female | Matilda | 5 |
| 9 | Performance | Music | Female | Olivia | 6 |
| 10 | Performance | Music | Male | Nicholas | 9 |
| 11 | Performance | Music | Male | Paul | 2 |
| 12 | Performance | Drama | Female | Matilda | 7 |
| 13 | Performance | Drama | Female | Olivia | 8 |
| 14 | Performance | Drama | Male | Nicholas | 12 |
| 15 | Performance | Drama | Male | Paul | 3 |
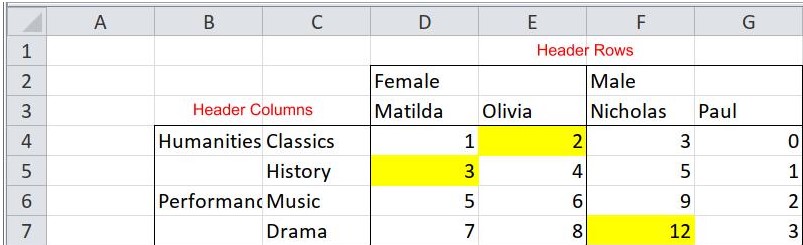
Case 2 : Multiple rows or columns of headers, with meaningful formatting#
Same as above, except we have to capture the format details. To get the colour information, we’ll make use of the xlsx_cells function from pyjanitor - under the hood, it uses openpyxl.
Observations:
The first row is the gender; the next row are the names.
The first column are the fields; the next column are the subjects
The scores are all integers.
The fonts are attached only to the scores.
Plan of action - get the respective fields and combine based on row/column positions:
frame = jn.xlsx_cells(
    excel_file, sheetnames="pivot-annotations", include_blank_cells=False, fill=True
).astype({"row": np.int8, "column": np.int8})
frame.head()
| value | internal_value | coordinate | row | column | data_type | is_date | number_format | fill | |
|---|---|---|---|---|---|---|---|---|---|
| 0 | Female | Female | D2 | 2 | 4 | s | False | General | {'patternType': None, 'fgColor': {'rgb': '0000... |
| 1 | Male | Male | F2 | 2 | 6 | s | False | General | {'patternType': None, 'fgColor': {'rgb': '0000... |
| 2 | Matilda | Matilda | D3 | 3 | 4 | s | False | General | {'patternType': None, 'fgColor': {'rgb': '0000... |
| 3 | Olivia | Olivia | E3 | 3 | 5 | s | False | General | {'patternType': None, 'fgColor': {'rgb': '0000... |
| 4 | Nicholas | Nicholas | F3 | 3 | 6 | s | False | General | {'patternType': None, 'fgColor': {'rgb': '0000... |
Get the gender and names:
rows = frame.row.unique()[:2]
gender = frame.loc[frame.row == rows[0], ["value", "column"]]
gender = gender.rename(columns={"value": "gender"})
names = frame.loc[frame.row == rows[1], ["value", "column"]]
names = names.rename(columns={"value": "name"})
gender_and_names = names.merge(gender, on="column", how="left").ffill()
gender_and_names
| name | column | gender | |
|---|---|---|---|
| 0 | Matilda | 4 | Female |
| 1 | Olivia | 5 | Female |
| 2 | Nicholas | 6 | Male |
| 3 | Paul | 7 | Male |
Get the field and subjects:
columns = np.unique(frame.column)[:2]
field = frame.loc[frame.column == columns[0], ["value", "row"]]
field = field.rename(columns={"value": "field"})
subjects = frame.loc[frame.column == columns[1], ["value", "row"]]
subjects = subjects.rename(columns={"value": "subject"})
field_and_subjects = subjects.merge(field, on="row", how="left").ffill()
field_and_subjects
| subject | row | field | |
|---|---|---|---|
| 0 | Classics | 4 | Humanities |
| 1 | History | 5 | Humanities |
| 2 | Music | 6 | Performance |
| 3 | Drama | 7 | Performance |
Get the scores and colours:
# get the scores
booleans = frame.data_type.eq("n")
data = frame.loc[booleans, ["value", "row", "column"]].rename(
    columns={"value": "score"}
)
# get the colours
fonts = frame.fill.str.get("fgColor").str.get("rgb")
fonts = fonts[booleans]
data["font"] = fonts
data
| score | row | column | font | |
|---|---|---|---|---|
| 8 | 1 | 4 | 4 | 00000000 |
| 9 | 2 | 4 | 5 | FFFFFF00 |
| 10 | 3 | 4 | 6 | 00000000 |
| 11 | 0 | 4 | 7 | 00000000 |
| 13 | 3 | 5 | 4 | FFFFFF00 |
| 14 | 4 | 5 | 5 | 00000000 |
| 15 | 5 | 5 | 6 | 00000000 |
| 16 | 1 | 5 | 7 | 00000000 |
| 19 | 5 | 6 | 4 | 00000000 |
| 20 | 6 | 6 | 5 | 00000000 |
| 21 | 9 | 6 | 6 | 00000000 |
| 22 | 2 | 6 | 7 | 00000000 |
| 24 | 7 | 7 | 4 | 00000000 |
| 25 | 8 | 7 | 5 | 00000000 |
| 26 | 12 | 7 | 6 | FFFFFF00 |
| 27 | 3 | 7 | 7 | 00000000 |
Combine into a single DataFrame:
(
    data.merge(field_and_subjects, on="row", how="left")
    .merge(gender_and_names, on="column", how="left")
    .loc[:, ["name", "gender", "field", "subject", "score", "font"]]
)
| name | gender | field | subject | score | font | |
|---|---|---|---|---|---|---|
| 0 | Matilda | Female | Humanities | Classics | 1 | 00000000 |
| 1 | Olivia | Female | Humanities | Classics | 2 | FFFFFF00 |
| 2 | Nicholas | Male | Humanities | Classics | 3 | 00000000 |
| 3 | Paul | Male | Humanities | Classics | 0 | 00000000 |
| 4 | Matilda | Female | Humanities | History | 3 | FFFFFF00 |
| 5 | Olivia | Female | Humanities | History | 4 | 00000000 |
| 6 | Nicholas | Male | Humanities | History | 5 | 00000000 |
| 7 | Paul | Male | Humanities | History | 1 | 00000000 |
| 8 | Matilda | Female | Performance | Music | 5 | 00000000 |
| 9 | Olivia | Female | Performance | Music | 6 | 00000000 |
| 10 | Nicholas | Male | Performance | Music | 9 | 00000000 |
| 11 | Paul | Male | Performance | Music | 2 | 00000000 |
| 12 | Matilda | Female | Performance | Drama | 7 | 00000000 |
| 13 | Olivia | Female | Performance | Drama | 8 | 00000000 |
| 14 | Nicholas | Male | Performance | Drama | 12 | FFFFFF00 |
| 15 | Paul | Male | Performance | Drama | 3 | 00000000 |
Case 3 : Mixed headers and notes in the same row/column, distinguished by formatting#
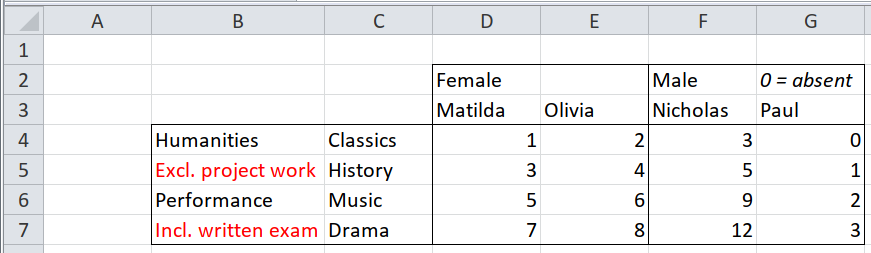
In this case, the highlighted texts should be excluded, as they are just notes and not relevant. Same goes for the 0=absent in G2 cell, which is italicized. red is identifed as FFFF0000, while italics should return True if it exists.
We’ll use the same steps as in the last solution:
frame = jn.xlsx_cells(
    excel_file, sheetnames="pivot-notes", include_blank_cells=False, font=True
)
frame.head()
| value | internal_value | coordinate | row | column | data_type | is_date | number_format | font | |
|---|---|---|---|---|---|---|---|---|---|
| 0 | Female | Female | D2 | 2 | 4 | s | False | General | {'name': 'Calibri', 'family': 2.0, 'sz': 11.0,... |
| 1 | Male | Male | F2 | 2 | 6 | s | False | General | {'name': 'Calibri', 'family': 2.0, 'sz': 11.0,... |
| 2 | 0 = absent | 0 = absent | G2 | 2 | 7 | s | False | General | {'name': 'Calibri', 'family': 2.0, 'sz': 11.0,... |
| 3 | Matilda | Matilda | D3 | 3 | 4 | s | False | General | {'name': 'Calibri', 'family': 2.0, 'sz': 11.0,... |
| 4 | Olivia | Olivia | E3 | 3 | 5 | s | False | General | {'name': 'Calibri', 'family': 2.0, 'sz': 11.0,... |
# exclude the italicised cell
italics = frame.font.str.get("i")
rows = frame.row.unique()[:2]
booleans = frame.row == rows[0]
booleans &= ~italics
gender = frame.loc[booleans, ["value", "column"]]
gender = gender.rename(columns={"value": "gender"})
names = frame.loc[frame.row == rows[1], ["value", "column"]]
names = names.rename(columns={"value": "name"})
gender_and_names = names.merge(gender, on="column", how="left").ffill()
gender_and_names
| name | column | gender | |
|---|---|---|---|
| 0 | Matilda | 4 | Female |
| 1 | Olivia | 5 | Female |
| 2 | Nicholas | 6 | Male |
| 3 | Paul | 7 | Male |
# exclude the cells with red font -> FFFF0000
red = frame.font.str.get("color").str.get("rgb") != "FFFF0000"
columns = np.unique(frame.column)[:2]
booleans = frame.column == columns[0]
booleans &= red
field = frame.loc[booleans, ["value", "row"]]
field = field.rename(columns={"value": "field"})
subjects = frame.loc[frame.column == columns[1], ["value", "row"]]
subjects = subjects.rename(columns={"value": "subject"})
field_and_subjects = subjects.merge(field, on="row", how="left").ffill()
field_and_subjects
| subject | row | field | |
|---|---|---|---|
| 0 | Classics | 4 | Humanities |
| 1 | History | 5 | Humanities |
| 2 | Music | 6 | Performance |
| 3 | Drama | 7 | Performance |
booleans = frame.data_type.eq("n")
data = frame.loc[booleans, ["value", "row", "column"]].rename(
    columns={"value": "score"}
)
data
| score | row | column | |
|---|---|---|---|
| 9 | 1 | 4 | 4 |
| 10 | 2 | 4 | 5 |
| 11 | 3 | 4 | 6 |
| 12 | 0 | 4 | 7 |
| 15 | 3 | 5 | 4 |
| 16 | 4 | 5 | 5 |
| 17 | 5 | 5 | 6 |
| 18 | 1 | 5 | 7 |
| 21 | 5 | 6 | 4 |
| 22 | 6 | 6 | 5 |
| 23 | 9 | 6 | 6 |
| 24 | 2 | 6 | 7 |
| 27 | 7 | 7 | 4 |
| 28 | 8 | 7 | 5 |
| 29 | 12 | 7 | 6 |
| 30 | 3 | 7 | 7 |
(
    data.merge(field_and_subjects, on="row", how="left")
    .merge(gender_and_names, on="column", how="left")
    .loc[:, ["name", "gender", "field", "subject", "score"]]
)
| name | gender | field | subject | score | |
|---|---|---|---|---|---|
| 0 | Matilda | Female | Humanities | Classics | 1 |
| 1 | Olivia | Female | Humanities | Classics | 2 |
| 2 | Nicholas | Male | Humanities | Classics | 3 |
| 3 | Paul | Male | Humanities | Classics | 0 |
| 4 | Matilda | Female | Humanities | History | 3 |
| 5 | Olivia | Female | Humanities | History | 4 |
| 6 | Nicholas | Male | Humanities | History | 5 |
| 7 | Paul | Male | Humanities | History | 1 |
| 8 | Matilda | Female | Performance | Music | 5 |
| 9 | Olivia | Female | Performance | Music | 6 |
| 10 | Nicholas | Male | Performance | Music | 9 |
| 11 | Paul | Male | Performance | Music | 2 |
| 12 | Matilda | Female | Performance | Drama | 7 |
| 13 | Olivia | Female | Performance | Drama | 8 |
| 14 | Nicholas | Male | Performance | Drama | 12 |
| 15 | Paul | Male | Performance | Drama | 3 |
Case 4: Mixed levels of headers in the same row/column, distinguished by formatting#
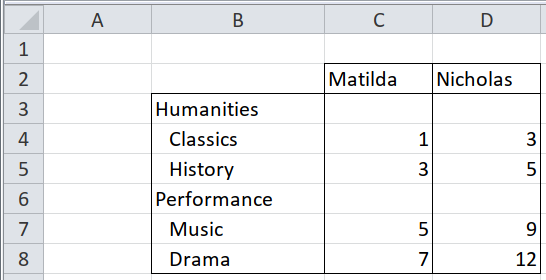
The formatting here refers to the indent - notice how Humanities and Performance are closer to the border compared to the subjects. Same goes for Matilda and Nicholas. Getting the indent information would require the use of Openpyxl. We also know that the fields is just one row above the respective subjects. Let’s use that knowlege in extracting our data:
frame = jn.xlsx_cells(
    excel_file, sheetnames="pivot-hierarchy", include_blank_cells=False, alignment=True
).astype({"row": np.int8, "column": np.int8})
frame.head()
| value | internal_value | coordinate | row | column | data_type | is_date | number_format | alignment | |
|---|---|---|---|---|---|---|---|---|---|
| 0 | Matilda | Matilda | C2 | 2 | 3 | s | False | General | {'horizontal': 'general', 'vertical': 'bottom'... |
| 1 | Nicholas | Nicholas | D2 | 2 | 4 | s | False | General | {'horizontal': 'general', 'vertical': 'bottom'... |
| 2 | Humanities | Humanities | B3 | 3 | 2 | s | False | General | {'horizontal': 'general', 'vertical': 'bottom'... |
| 3 | Classics | Classics | B4 | 4 | 2 | s | False | General | {'horizontal': 'left', 'vertical': 'bottom', '... |
| 4 | 1 | 1 | C4 | 4 | 3 | n | False | General | {'horizontal': 'general', 'vertical': 'bottom'... |
Get the field and subjects:
# fields and subjects are in the first column:
booleans = frame.alignment.str.get("indent").eq(0) & frame.column.eq(frame.column.min())
field = frame.loc[booleans, ["value", "row"]].assign(row=lambda f: f.row + 1)
field = field.rename(columns={"value": "field"})
booleans = frame.alignment.str.get("indent").gt(0) & frame.column.eq(frame.column.min())
subject = frame.loc[booleans, ["value", "row"]]
subject = subject.rename(columns={"value": "subject"})
field_and_subjects = subject.merge(field, on="row", how="left").ffill()
field_and_subjects
| subject | row | field | |
|---|---|---|---|
| 0 | Classics | 4 | Humanities |
| 1 | History | 5 | Humanities |
| 2 | Music | 7 | Performance |
| 3 | Drama | 8 | Performance |
Get the names:
# names are the very first row:
names = frame.loc[frame.row == frame.row.min(), ["value", "column"]]
names = names.rename(columns={"value": "name"})
names
| name | column | |
|---|---|---|
| 0 | Matilda | 3 |
| 1 | Nicholas | 4 |
Get the scores
scores = frame.loc[frame.data_type == "n", ["value", "row", "column"]]
scores = scores.rename(columns={"value": "score"})
scores
| score | row | column | |
|---|---|---|---|
| 4 | 1 | 4 | 3 |
| 5 | 3 | 4 | 4 |
| 7 | 3 | 5 | 3 |
| 8 | 5 | 5 | 4 |
| 11 | 5 | 7 | 3 |
| 12 | 9 | 7 | 4 |
| 14 | 7 | 8 | 3 |
| 15 | 12 | 8 | 4 |
(
    scores.merge(names, on="column", how="left")
    .merge(field_and_subjects, on="row", how="left")
    .loc[:, ["name", "field", "subject", "score"]]
)
| name | field | subject | score | |
|---|---|---|---|---|
| 0 | Matilda | Humanities | Classics | 1 |
| 1 | Nicholas | Humanities | Classics | 3 |
| 2 | Matilda | Humanities | History | 3 |
| 3 | Nicholas | Humanities | History | 5 |
| 4 | Matilda | Performance | Music | 5 |
| 5 | Nicholas | Performance | Music | 9 |
| 6 | Matilda | Performance | Drama | 7 |
| 7 | Nicholas | Performance | Drama | 12 |
Another route, without xlsx_cells:
(
    excel_file.parse(sheet_name="pivot-hierarchy", header=[0, 1])
    .droplevel(axis=1, level=0)
    .remove_empty()
    .set_axis(["subject", "Matilda", "Nicholas"], axis="columns")
    .assign(field=lambda f: f.subject.where(f.Matilda.isna()).ffill())
    .dropna()
    .melt(id_vars=["field", "subject"], var_name="name", value_name="score")
    .astype({"score": np.int8})
)
| field | subject | name | score | |
|---|---|---|---|---|
| 0 | Humanities | Classics | Matilda | 1 |
| 1 | Humanities | History | Matilda | 3 |
| 2 | Performance | Music | Matilda | 5 |
| 3 | Performance | Drama | Matilda | 7 |
| 4 | Humanities | Classics | Nicholas | 3 |
| 5 | Humanities | History | Nicholas | 5 |
| 6 | Performance | Music | Nicholas | 9 |
| 7 | Performance | Drama | Nicholas | 12 |
Comments#